Observed: 178 of 197 tracked instruments declined during the week ended November 6. Relative volume accelerated, while signed-volume participation weakened sharply.
Interpretation: We believe the combined breadth, volume and Elliott-wave evidence favors the start of a broader correction, although this remains a scenario rather than a confirmed outcome.
Key weekly observations
| Indicator | November 6, 2026 |
|---|---|
| Tracked instruments | 197 |
| Weekly decliners | 178 (90.36%) |
| Median weekly return | −12.65% |
| MA200 breadth | 30.26% (59/195) |
| Median relative volume | 1.39× |
| Median 52-week drawdown | −23.34% |
1. A week of exceptional selling
The ENERGY universe experienced a sharp, broad-based selloff in the week ended November 6. Its median weekly return was −12.65%, and 178 of 197 tracked instruments (90.36%) declined. This was not a setback confined to a handful of heavyweight constituents: the distribution of returns points to selling across producers, services, transportation, and several energy-related ETFs. The universe is heterogeneous, so these figures should not be interpreted as a pure oil-producer index.
2. Breadth collapses: a 38.46-percentage-point reversal
The share of eligible instruments above their 200-session moving average fell from 68.72% on October 30 to 30.26% on November 6, a drop of 38.46 percentage points in a single week. Recent observations had shown 62.05% on October 16 and 66.67% on October 23. The latest reading represents 59 of 195 eligible instruments. A moving average is lagging and a cross below it is not by itself proof of a prolonged bear market. Nevertheless, this many instruments losing a long-term technical reference almost simultaneously signals a substantial deterioration in market structure.
3. The bearish divergence preceded the break
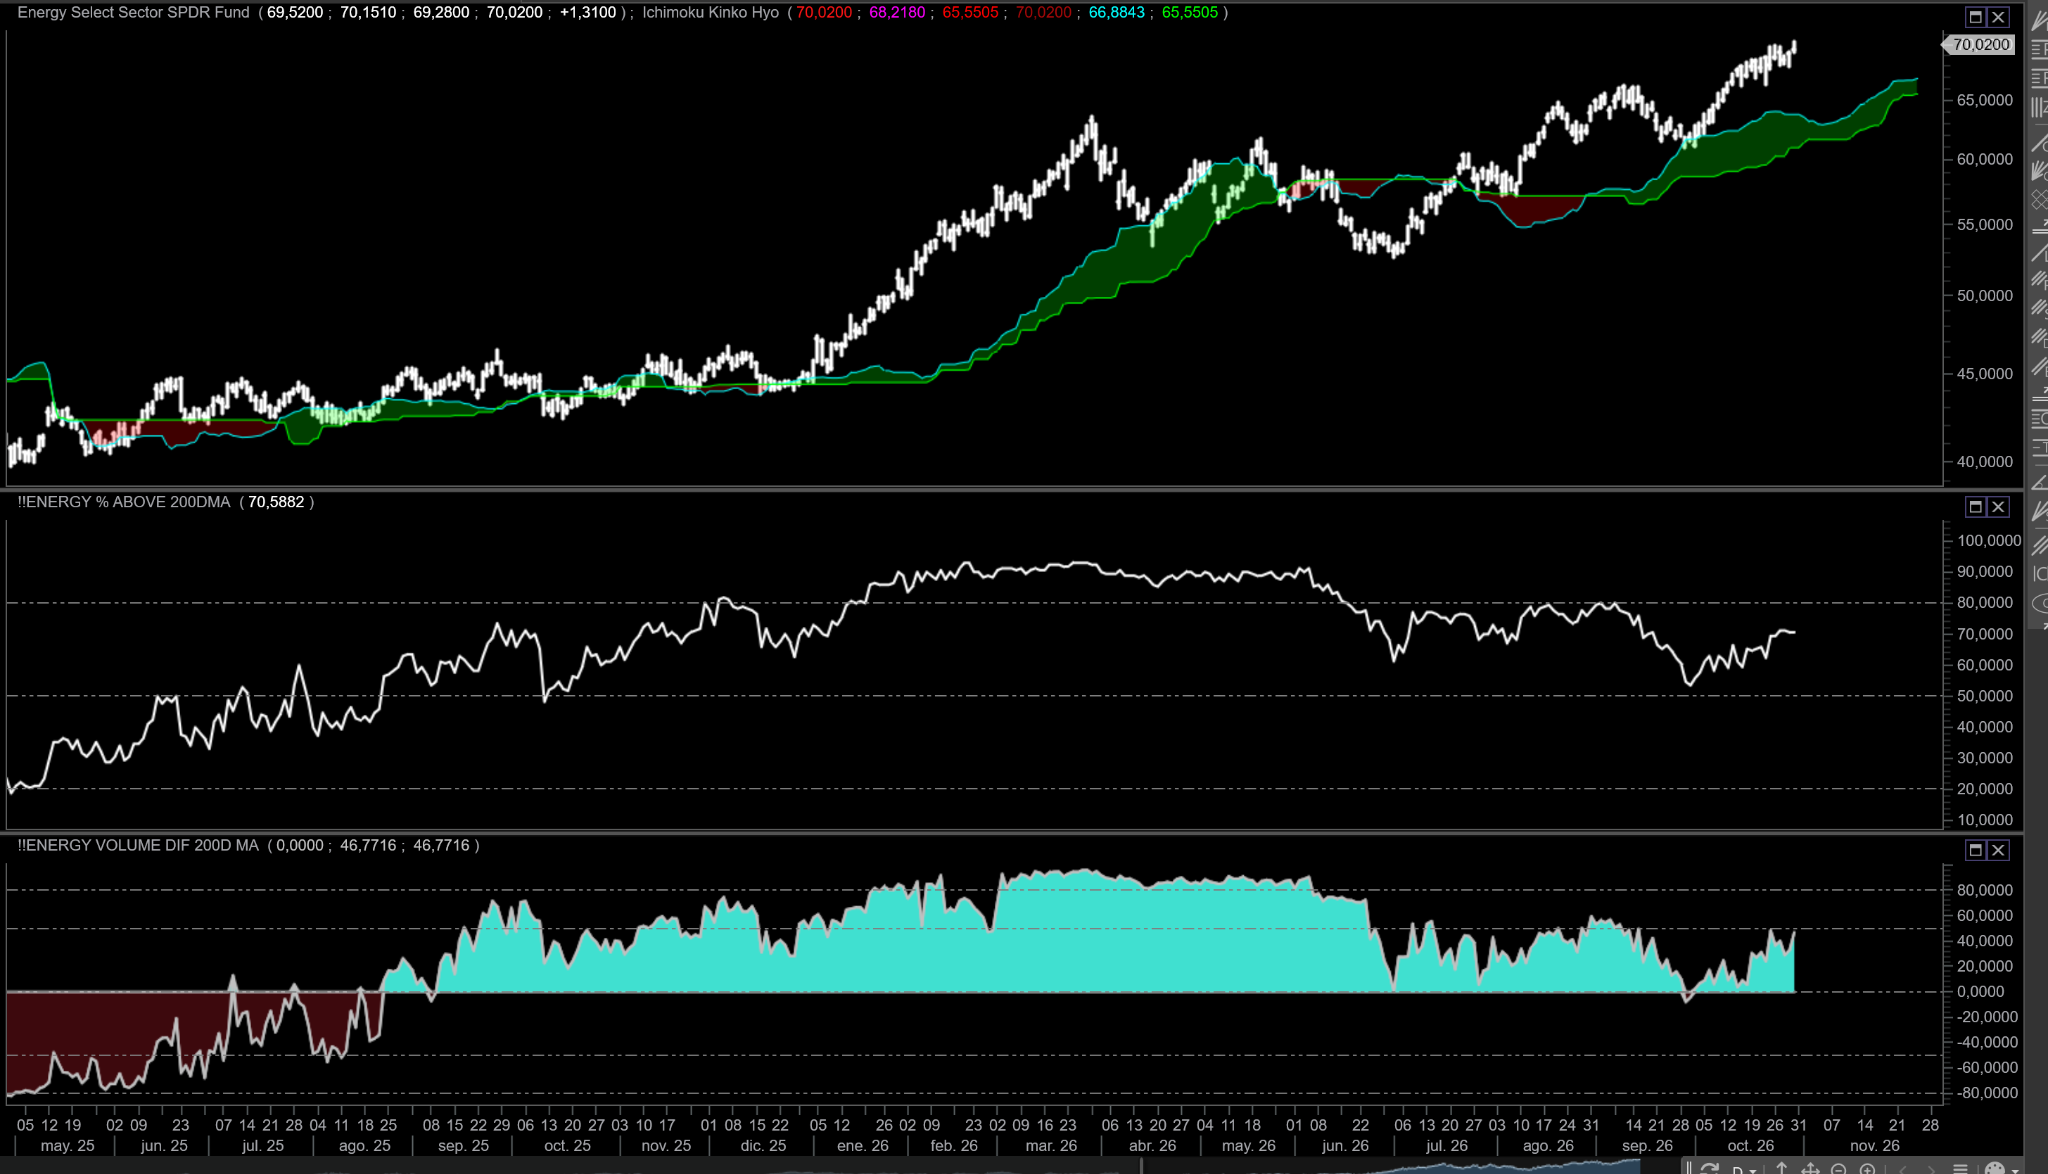
The longer-term XLE chart shows an extended divergence between ETF prices and the breadth of our broader ENERGY universe. XLE advanced toward fresh highs while the proportion of tracked instruments holding above MA200 failed to confirm the earlier breadth peaks. The ETF's capitalization-weighted construction can conceal weaker participation across a wider sector universe; this comparison is not a direct measure of breadth solely among XLE holdings. Divergences do not identify a precise reversal date. Here, however, the abrupt selloff has exposed the vulnerability implied by months of narrowing participation.
4. Volume confirms the intensity of the move
Median relative volume increased to approximately 1.39× from 0.97× in the preceding week. The share of instruments trading at 1.5× or more of reference volume jumped from 9.64% to 40.61%, while the share with positive signed-volume balance dropped from 69.54% to 30.46%. The accompanying historical directional-volume chart fell to approximately −46.85. Signed volume is a directional proxy, not a direct measurement of institutional inflows or outflows. Still, the combination of widespread price declines, unusually high activity, and strongly negative directional volume is consistent with intense selling pressure.
5. Elliott wave: a possible fifth-wave completion
Our proposed Elliott wave count identifies a five-wave advance within XLE's rising long-term channel. The latest high, near the channel's upper boundary, is compatible with a fifth-wave completion. The subsequent sharp reversal coincides with the longstanding breadth divergence and the breakdown in volume participation. Elliott labeling is interpretive, not an objective statistical confirmation, and alternative counts remain possible. Yet the convergence of these three observations increases the plausibility of a larger-degree correction rather than an isolated pullback.
6. XLE and Ichimoku: a technical structure under pressure
XLE finished the observation period near $61.62 after falling roughly 12.00% for the week. The decline brought the ETF toward an important Ichimoku cloud support region, while the lower boundary of the rising channel remains another reference to monitor. An oversold rebound would be entirely plausible after such a rapid fall. But a rebound alone would not establish that the correction has ended: if the fifth-wave interpretation is correct, rallies may form part of a broader corrective sequence. A sustained breakdown of channel support would reinforce the bearish case; recovering the cloud alongside expanding breadth and improving volume would weaken it.
7. The major oil names were not spared
Chevron fell 9.73%, Exxon Mobil 11.42%, ConocoPhillips 11.53%, Occidental Petroleum 11.91%, and XLE itself 12.00%. The exploration-and-production ETF XOP declined 14.72%. These moves show that weakness reached the sector's best-known benchmarks. Some alternative-energy names moved in the opposite direction: Array Technologies rose 72.71%, Sunrun 33.42%, and Clean Energy Fuels 32.64%. These exceptions underscore why the full distribution matters and why the ENERGY universe should not be treated as a single homogeneous industry.
8. Drawdowns reveal the damage
The median distance from 52-week highs worsened from roughly −9.88% to −23.34% in one week. The share of instruments more than 30% below their 52-week highs increased from 17.44% to 32.31%. Such a sudden deterioration in drawdowns is difficult to reconcile with an assumption that the underlying trend remains uniformly healthy. It does not prove every stock must fall further, but it demonstrates a material change in the risk profile.
9. Our assessment: more likely the beginning than the end
Our primary scenario is bearish. We do not regard the week's collapse as an automatic buying opportunity. The speed of the breadth contraction, the intensity of selling volume, the pre-existing divergence, and the plausible fifth-wave completion together suggest that the sector may be entering a correction of greater magnitude. We believe this week's fall is more likely an early manifestation of that process than its final stage. This is an interpretation of observed evidence, not a confirmed forecast or a precise target for either the depth or duration of the decline.
10. What would change our view?
A durable rebound in MA200 participation, broader improvement in signed-volume balance, and sustained recovery of XLE's damaged technical levels would challenge the bearish interpretation. A rebound led only by a few large-cap names would be less persuasive than one supported across the tracked universe. Until the internal structure begins to recover, we would treat short-term rallies cautiously.
Historical context and chart
The preceding October 30 ENERGY study documents the earlier divergence and the participation recovery that preceded the latest breakdown. Its XLE versus ENERGY breadth chart provides historical context. The current Elliott-wave count is an interpretive overlay, not an independently verified price target.
See also the public methodology guide.
11. Complete ENERGY ranking — 197 instruments
Search, sort and compare all tracked instruments. Weekly rank, global rank, ticker, company, last close, one-week, four-week, three-month and year-to-date returns are available for every row. Ranking positions are descriptive, not investment recommendations.
12. Methodology and limitations
Cutoff: November 6, 2026. Publication: November 7, 2026. The ENERGY universe contains 197 tracked instruments, including oil and gas producers, services, transport, alternative-energy companies, ETFs and some cross-listed securities; it does not represent 197 independent oil producers. The MA200 breadth denominator is 195 instruments with valid observations. Cross-sectional returns are summarized using medians. Relative volume compares recent activity with its reference period; signed volume is a directional proxy, not direct capital-flow data. Elliott-wave labeling is interpretive. No proprietary ranking rules or trading algorithms are disclosed. Rankings are descriptive, not personalized investment advice.
Conclusion: the internal warning is now visible in prices
For months, the ETF's price advance outpaced the broader universe's long-term participation. This week, the divergence was followed by an exceptionally fast collapse in breadth and intense selling volume. Together with a plausible completed fifth wave, these developments support our central thesis: the energy sector has probably begun a larger correction, and the latest fall may be its first major manifestation rather than its conclusion. The magnitude and duration remain unknown; sustained recovery in participation and volume would require us to reconsider.