Observed: Among 98 tracked SIL–SILJ instruments during October 23–30, 2026, 79 declined, 17 rose and two were unchanged. Of the 97 with a valid 200-day moving average, only six finished above it. The universe includes miners, royalty companies, diversified metals businesses and exchange-traded instruments, not exclusively pure-play silver producers.
1. Market breadth has collapsed to an exceptional low
On October 30, just 6.19% (6/97) of the instruments with valid data traded above their 200-day moving average (MA200), down from 36.08% (35/97) four weeks earlier. The 29.90-percentage-point decline reflects a broad breakdown of long-term trend participation, not merely a fall in the two headline ETFs.
The median distance from MA200 is −22.91%, suggesting that the typical tracked security is substantially below its long-term average rather than hovering just beneath it. A recovery in SIL or SILJ alone would not establish that the broader universe has repaired this damage.
Six-week deterioration
| Date | Above MA200 | Valid / above | Median weekly return |
|---|---|---|---|
| Sep 18 | 54.17% | 52 / 96 | −0.19% |
| Sep 25 | 44.79% | 43 / 96 | −2.37% |
| Oct 2 | 36.08% | 35 / 97 | −5.96% |
| Oct 9 | 32.99% | 32 / 97 | −0.91% |
| Oct 16 | 26.80% | 26 / 97 | −5.64% |
| Oct 23 | 12.37% | 12 / 97 | −9.26% |
| Oct 30 | 6.19% | 6 / 97 | −3.48% |
Across these seven observations, the weekly median return was negative every time. The decline in participation has therefore been persistent rather than the result of one isolated trading week.
2. A breadth reading last seen near the end of the 2023 bear-market phase
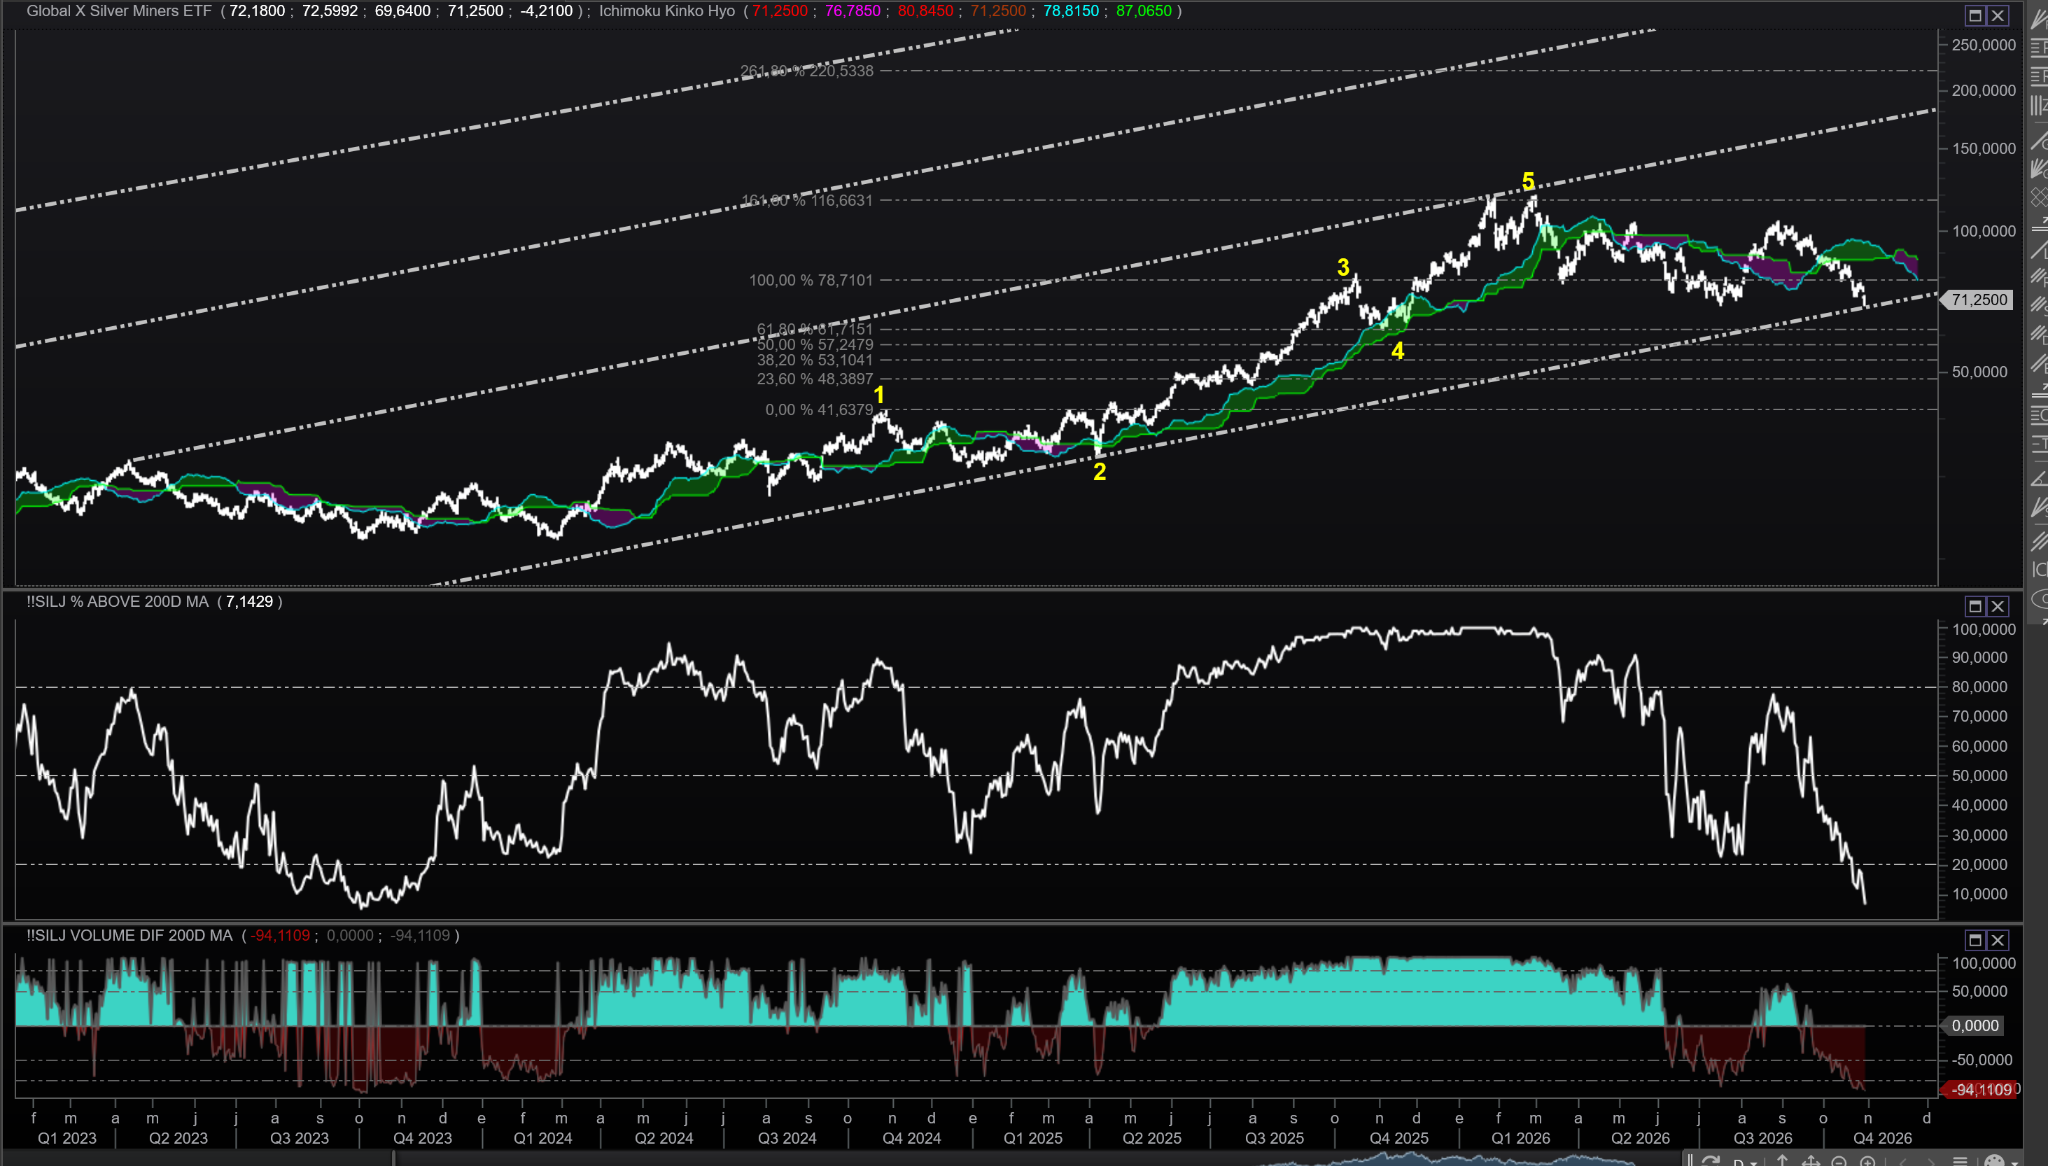
The author's original multi-panel SIL chart provides an important historical perspective. The current percentage of SIL–SILJ securities above MA200 is near the extreme lows visible around October 2023, during the late phase of the preceding bear market. In the chart, SIL trades near 71.25 while the long-term breadth indicator falls to single digits and the volume-difference indicator is deeply negative.
Historical comparison, not a bottom signal: the resemblance concerns the level of market participation. It does not establish that today's price structure, duration, fundamentals or subsequent returns will replicate October 2023. Breadth extremes can persist, and the indicator by itself does not predict the timing of a durable reversal.
3. The six remaining securities above MA200
These are the only six instruments with a positive MA200 distance in the October 30 dataset. They are not all pure-play silver miners, and their continued position above MA200 is not a guarantee of further gains.
| Company | Ticker | Distance above MA200 | 1W return |
|---|---|---|---|
| Minera Frisco | MFRISCOA1.MX | +32.04% | −2.35% |
| Sailfish Royalty | FISH.V | +29.21% | −13.66% |
| Liberty Gold | LGD.TO | +24.61% | +2.66% |
| Aya Gold & Silver | AYA.TO | +11.22% | −3.48% |
| Sandfire Resources | SFR.AX | +3.49% | +9.16% |
| Panoro Minerals | PML.V | +2.77% | 0.00% |
Sailfish illustrates why MA200 resilience and short-term performance must be distinguished: it remains materially above its moving average despite a 13.66% weekly decline. Meanwhile, Silver Mines (+19.05%) and Argent Minerals (+17.65%) led the weekly gainers but remain below their own MA200 levels. A sharp weekly bounce does not automatically repair the medium-term trend.
4. Weekly losses are broad, not isolated
Across all 98 tracked instruments, 79 declined (80.61%), 17 advanced (17.35%) and two were unchanged. The median weekly return was −3.48%; 35 instruments lost at least 5%, and nine lost 10% or more. This distribution is consistent with widespread selling pressure rather than weakness confined to a few heavily weighted names.
Among the larger weekly gainers were Silver Mines (+19.05%), Argent Minerals (+17.65%) and Sandfire Resources (+9.16%). These isolated advances should not be confused with an improvement in aggregate participation.
5. Drawdowns point to extensive damage
The median drawdown from 52-week closing highs reached −46.94%, versus −41.49% one week earlier. Of 96 instruments with valid drawdown observations, 91 (94.79%) were more than 20% below their respective highs and 40 (41.67%) were more than 50% below them.
The difference between a temporary ETF pullback and a severely damaged cross-section is crucial: most securities are not simply retreating from recent highs; many have experienced substantial declines.
6. Directional volume remains unfavorable
The median 20-session signed-volume balance improved from −29.76% to −25.48%, but remained deeply negative. Only four of 98 tracked instruments showed a positive balance. Median five-session relative volume was 0.87× its reference level, which does not suggest a broad surge in activity accompanying an upward reversal.
Signed-volume balance is a directional proxy, not a direct measurement of capital inflows or outflows. Its persistent weakness reinforces the breadth assessment but does not independently establish what prices will do next.
7. Interpretation: an extreme is not yet confirmation of a bottom
Measured evidence: MA200 participation is near a multi-year low, weekly declines are widespread, drawdowns are deep, and directional volume remains negative. Interpretation: the silver-mining complex is displaying an unusually damaged internal structure, potentially vulnerable to further declines but also capable of sharp countertrend rallies.
Scenario to monitor: a durable recovery would become more credible if breadth stabilized, the number of securities above MA200 began to rebuild, drawdowns stopped deepening, and directional-volume participation broadened. None of those developments is guaranteed by the present oversold-looking breadth reading. The October 2023 comparison is a historical reference point, not a forecast.
8. Complete SIL–SILJ ranking — 98 instruments
Search, sort and compare all tracked instruments. Weekly rank, global rank, ticker, company, last close, one-week, four-week, three-month and year-to-date returns are available for every row. Ranking positions are descriptive, not investment recommendations.
9. Data, methodology and limitations
The analysis covers the 98 tracked instruments in the October 30, 2026 SIL–SILJ Weekly Analysis dataset, including SIL, SILJ and other non-pure-play silver securities. MA200 breadth uses 97 valid observations; 52-week drawdown statistics use 96. Percentages are calculated on their stated valid denominators, and medians are cross-sectional. Four-week breadth comparisons use the corresponding October 2 snapshot. Historical breadth comparisons may be sensitive to constituent coverage and changes in the universe over time.
All 98 rows of the original nine-column public ranking are available below and in the downloadable ranking JSON. The underlying private analytical workbook and proprietary ranking methods are not published. See the public methodology guide.
Conclusion: an exceptionally weak market structure
With only 6.19% of eligible securities above MA200, a −46.94% median 52-week drawdown and a persistently negative volume balance, SIL–SILJ shows broad and deep deterioration. The author's historical chart places current breadth near readings last visible around the late-2023 bear-market phase, but this is not evidence that a new bottom has been confirmed.
The appropriate distinction is between describing an extreme and predicting its resolution. We will monitor whether participation and volume improve before treating any rebound as a sustained change in market structure.