Two long-term relative-strength structures suggest that the precious metals bull market may be approaching an important turning point. If the emerging signals are confirmed, silver mining stocks could become one of the most interesting areas to watch.
Technical observations from charts dated November 8, 2026. Ratio values are approximate. Elliott Wave counts are interpretive, not statistical forecasts.
The Opportunity Behind the Ratios
Some of the most significant market opportunities emerge when several long-term technical developments begin to align. We may be approaching one of those moments in precious metals. Our working hypothesis follows a potential sequence: gold advances; silver outperforms gold; and precious metals miners outperform silver. If these developments unfold together, the implications for silver mining equities could be substantial. The argument rests on two long-term relative-strength charts, not on a claim that the outcome is inevitable.
1. Gold/Silver: A Major Resistance Backtest
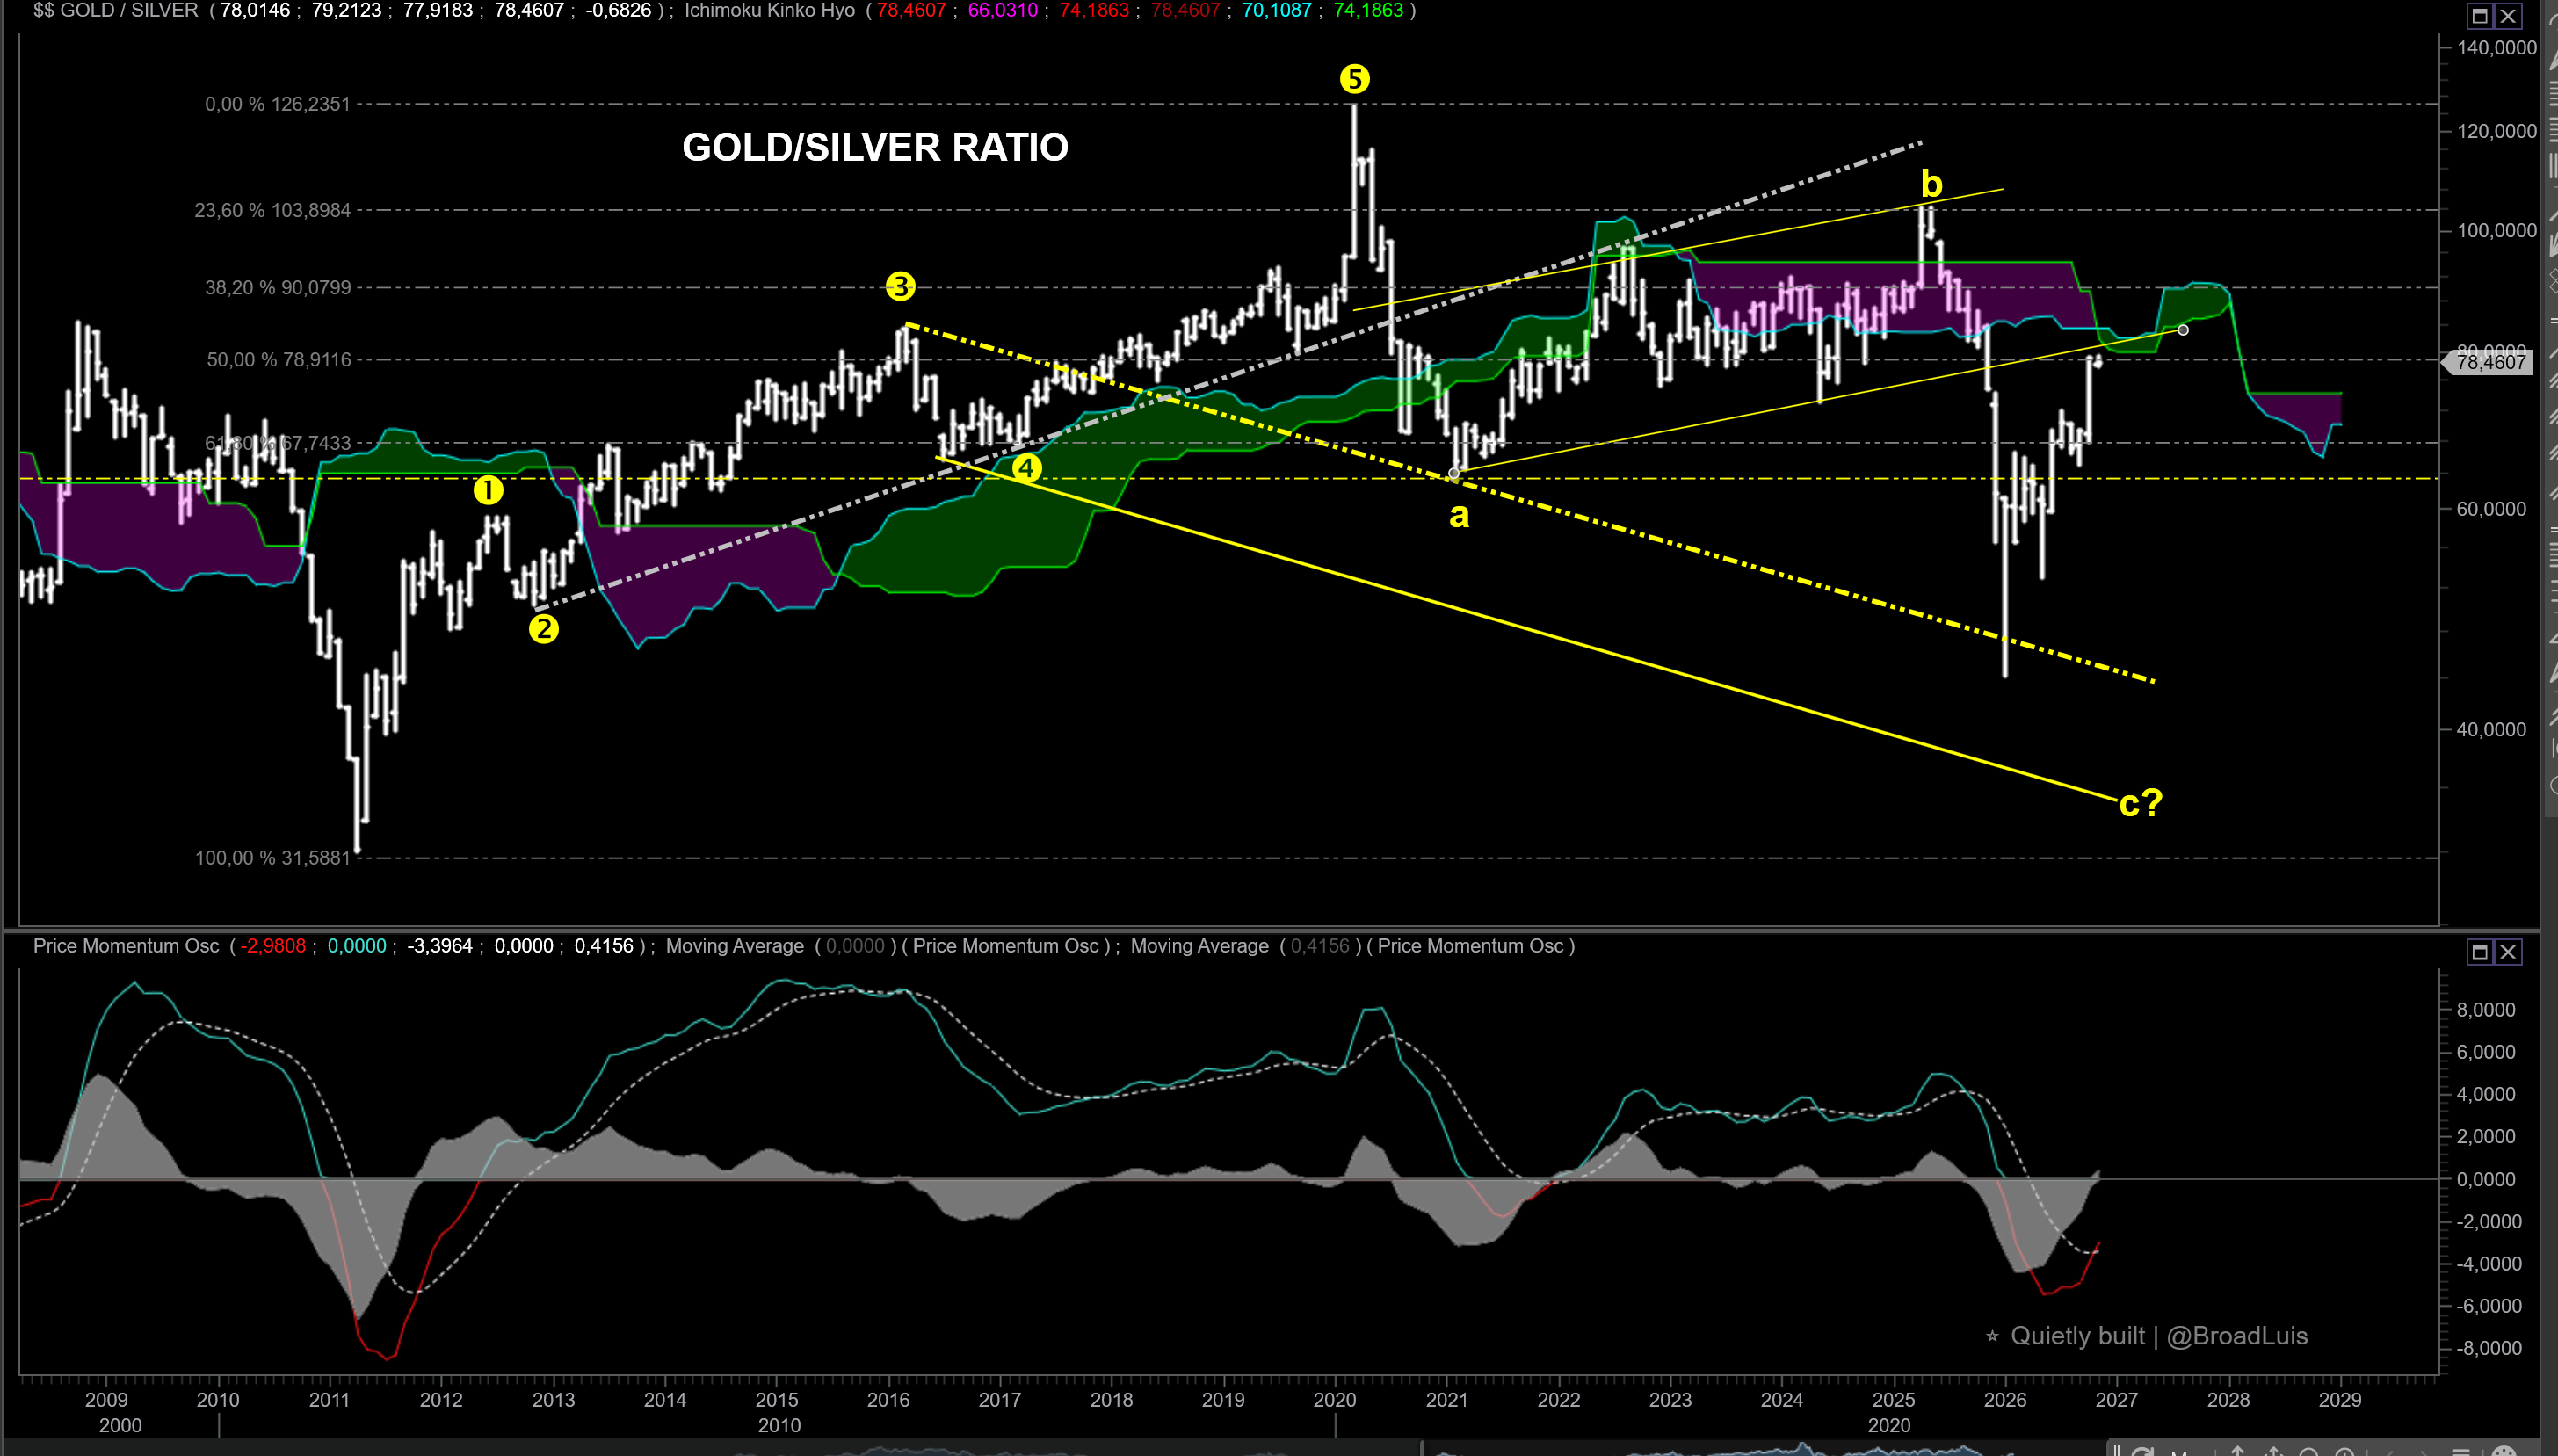
The Gold/Silver ratio stands near 78 on the accompanying November 2026 chart, following a powerful decline and subsequent recovery. The important technical feature is its approach to a former long-term support trendline, now acting as potential resistance. From an Elliott Wave perspective, one possible interpretation is that the rebound represents a corrective wave b before a renewed decline in wave c. This is a working count, not a confirmed one. A renewed decline in the ratio would mean silver outperforming gold. The 67–68 region is an initial downside reference; a sustained move below it would strengthen the case for a larger decline. Conversely, a decisive recovery through the resistance structure would challenge this interpretation.
2. XAU/Silver: Are Mining Stocks Preparing to Take the Lead?
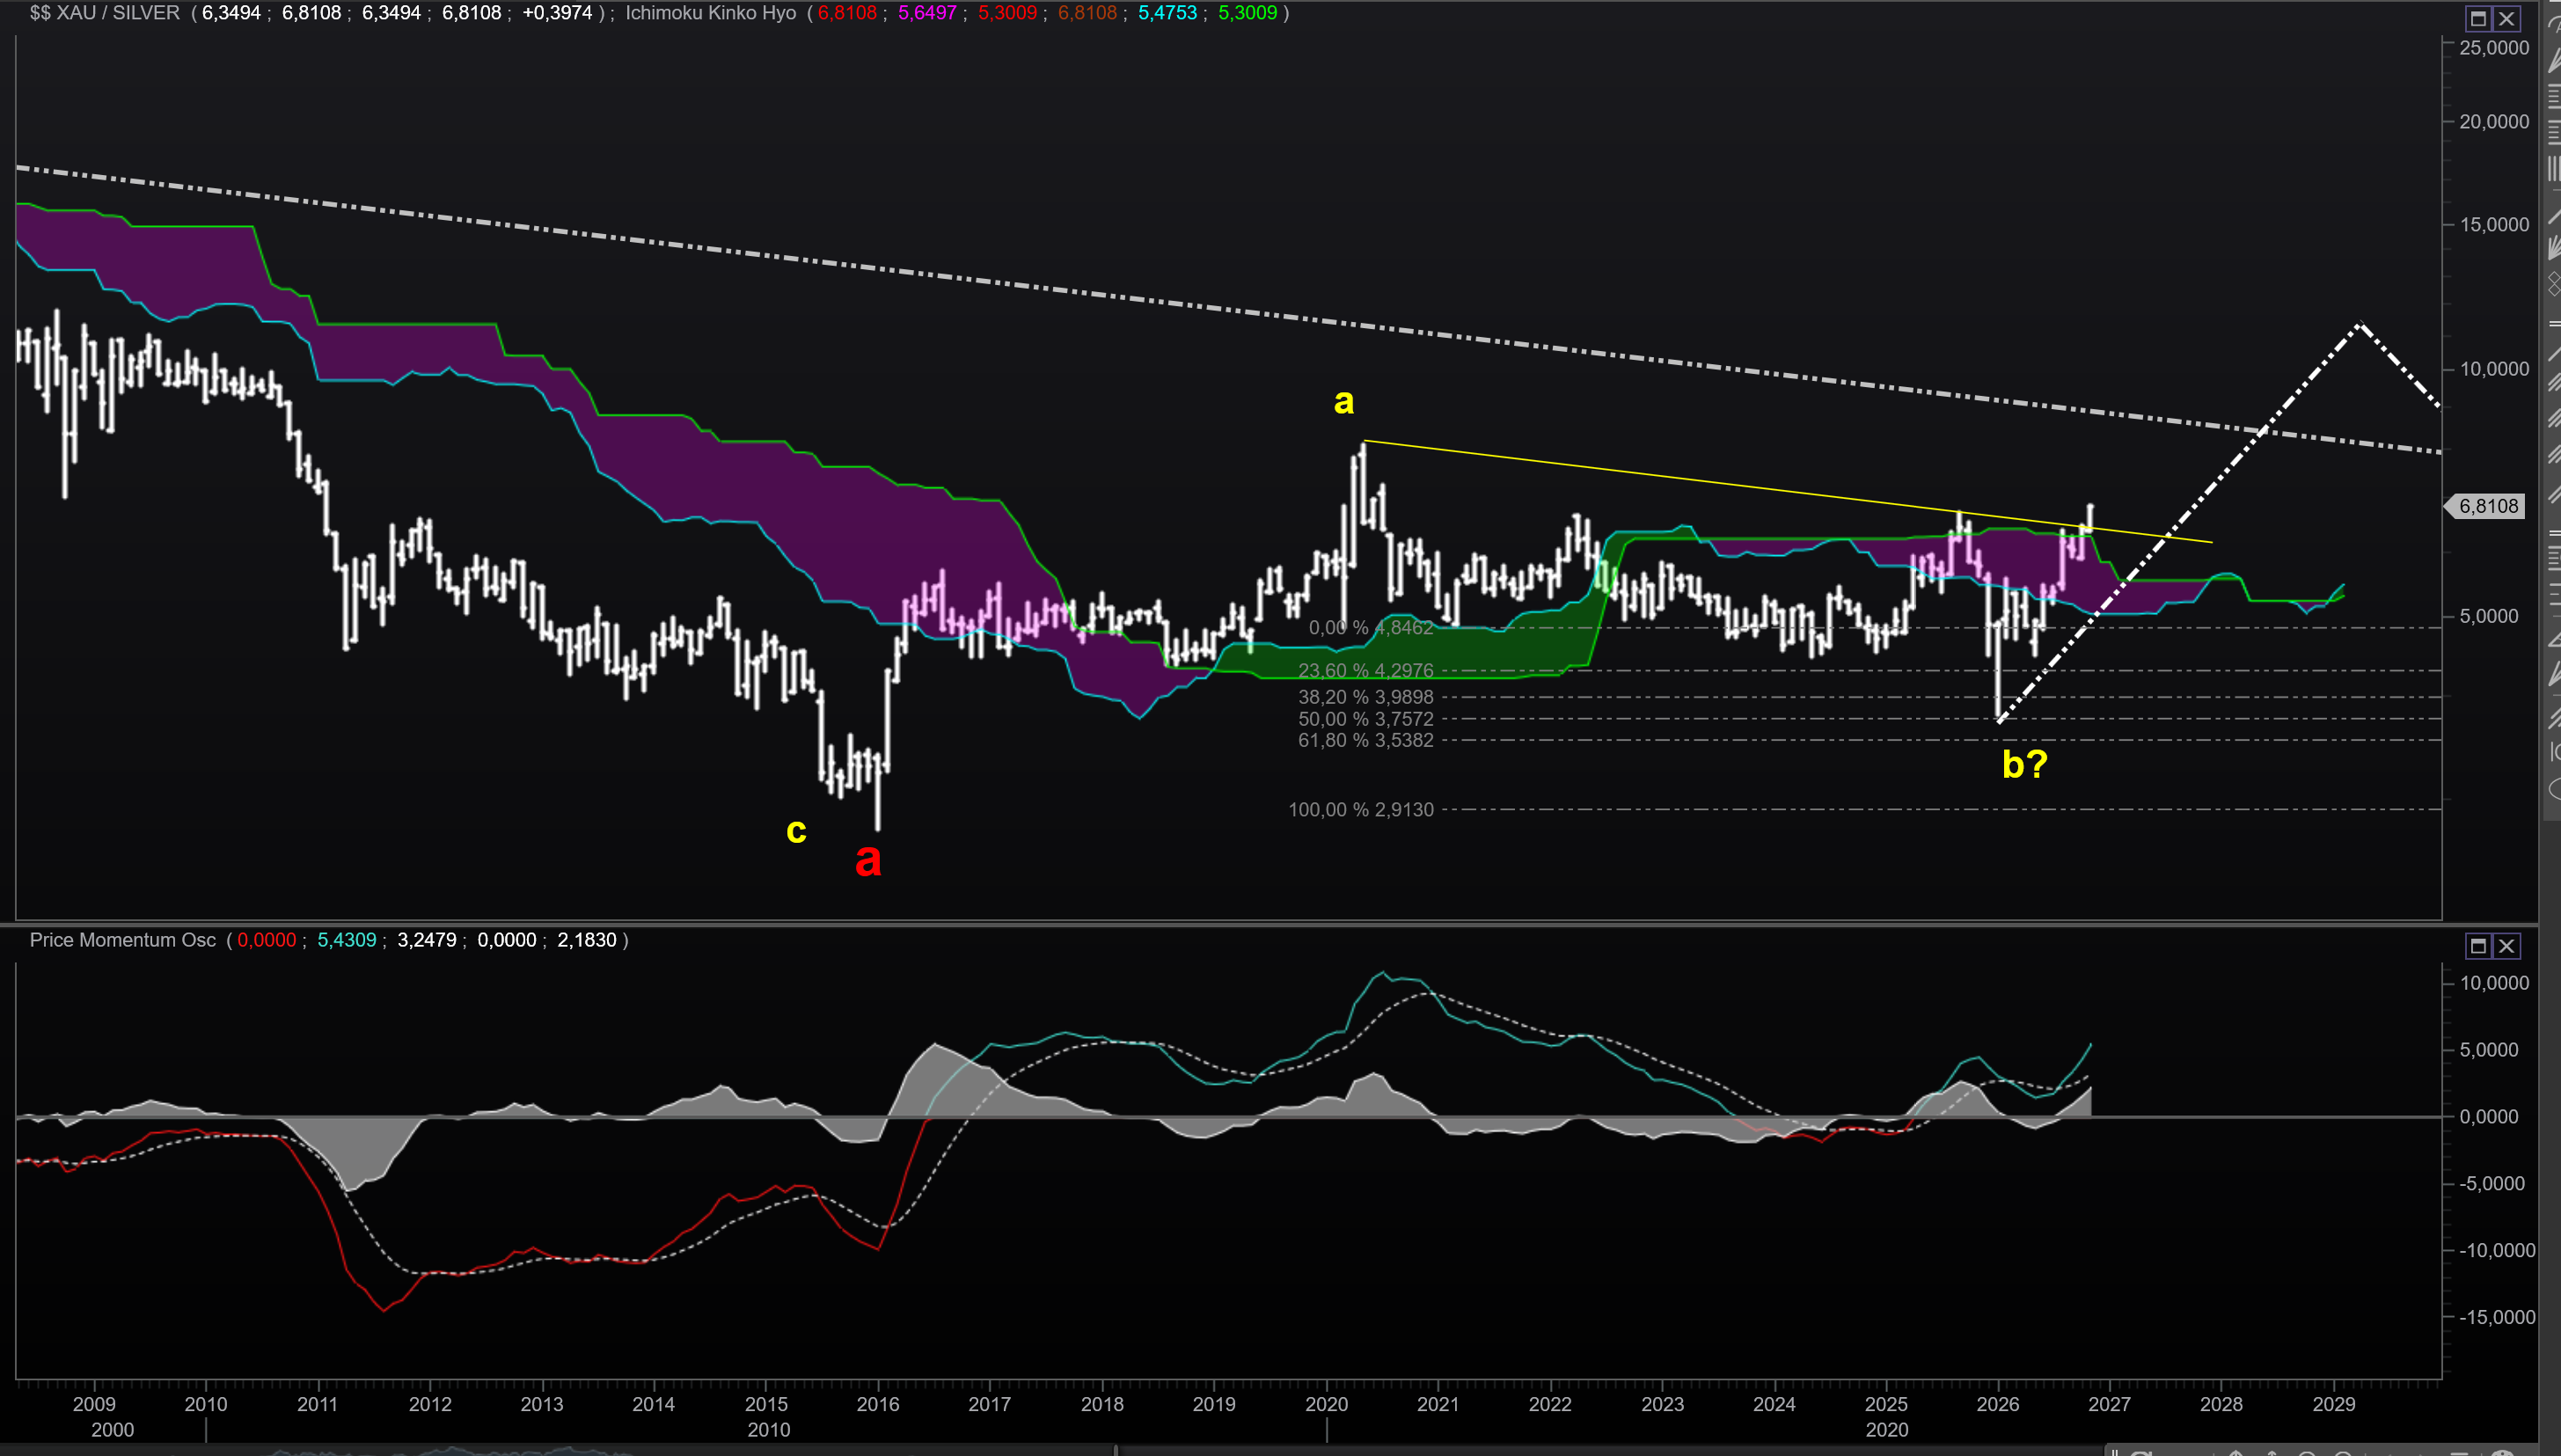
The XAU/Silver ratio is near 6.81 on the November 2026 chart. After a long period of relative weakness, the ratio has challenged and moved above an initial descending resistance line. Its momentum oscillator is improving, although the longer-term resistance structure remains an obstacle. The sharp 2026 decline and rebound may fit a corrective pattern ending in a new relative advance, but the wave count is provisional. The next test is whether the ratio can sustain the breakout and progress toward the more important overhead resistance. A single resistance-line break does not, by itself, establish a new long-term leadership regime.
3. Why the Combination Matters
Consider the sequence. First: gold resumes its broader advance, providing a supportive environment for precious metals. Second: the Gold/Silver ratio falls, signaling that silver is gaining ground against gold. Third: XAU/Silver rises, suggesting that precious metals mining equities are gaining ground against silver. The combination would create an unusually constructive relative backdrop for mining shares. Our particular interest is in silver miners, which could benefit from a stronger silver market and renewed demand for mining equities. There is an essential distinction, however: XAU is not a pure silver-miner index. This ratio supports a thesis of precious metals mining strength relative to silver, but specific silver-miner leadership over gold miners needs independent confirmation from comparisons such as SIL/GDX or SILJ/GDXJ.
4. What Would Challenge the Thesis?
A sustained Gold/Silver breakout above its major resistance would undermine the anticipated silver outperformance. A failed XAU/Silver breakout followed by renewed relative weakness would challenge the mining-equity leadership scenario. And a broader deterioration in precious metals trends could delay or prevent the expected advance. Elliott Wave paths on the original technical charts should be understood as conditional scenarios, not fixed forecasts. Price behavior around support and resistance matters more than the elegance of any proposed wave count.
5. Investment Implications
The most compelling opportunities do not always arrive after uncertainty has disappeared. Sometimes they emerge when long-term structures begin to improve while confirmation is still incomplete. That may be the case in precious metals. But not every silver mining company will participate equally: operating costs, balance-sheet resilience, dilution, jurisdictional exposure and execution risk remain important. Relative strength also does not prevent substantial drawdowns. Our central hypothesis is that the next major phase of the precious metals bull market could feature silver outperforming gold and mining equities outperforming the underlying metal. If so, silver mining stocks deserve particularly close attention.
Conclusion: A Rare Alignment Worth Watching
We cannot know in advance whether this will become a once-in-a-generation opportunity. What we can observe is that Gold/Silver is testing a major resistance structure while XAU/Silver is attempting to establish renewed relative strength. Both developments could coincide with a resumption of the broader precious metals advance. Gold may lead. Silver may outperform gold. Mining stocks may outperform silver. This is our preferred technical scenario—not a confirmed outcome. If the market validates it, silver miners will be among the areas we monitor most closely.
Methodology and further reading
Relative ratios compare the price performance of one asset with another; they do not independently establish absolute returns. Read our research methodology and explore Market Perspectives.
This article expresses an independent technical market hypothesis for informational purposes and is not personalized investment advice.